5.2 Results
PFP researchers were interested in how much Hopi maize could be grown in the Mesa Verde region, and whether the phenotype—or physical characteristics—of Hopi maize grown in the Mesa Verde region would be different from that grown on the Hopi Mesas. Here, we present analyses of maize growth (the phenology of maize), maize yield, and ear diversity (phenotype).
Maize growth
The timing of maize growth stages was variable across the Pueblo Farming Project gardens. The data and graph below report the growth data for each of the gardens for every year of the Pueblo Farming Project. Because the different clumps of maize (and even maize plants within a clump) mature at different rates, Pueblo Farming Project researchers reported the proportion of clumps that reached a given growth stage. So for example, in the table below, a “tasseling” proportion of 0.343 in the Check Dam Garden (CDG) on August 6, 2009, means that 34.3% of clumps in the CDG showed signs of tasseling by that date. The data presented below are a summary of the raw growth data, which are available here.
An important thing to consider is the timing of tasseling relative to silking. The tassels of maize plants are their flowers—tassels produce pollen that must fall upon silks in order to produce maize kernels. If tasseling and silking don’t happen at nearly the same time, pollenation doesn’t occur, and the ears won’t develop. If tasseling happens long before silking, the pollen will fall to the ground. The graph below allows you to select a year and visualize the relative timing of tasseling and silking (and the other growth stages). You’ll notice that the highest yielding gardens such as the Check Dam Garden (CDG) have silk development and silking occurring within about a week after tasseling. In other gardens, such as Karen’s Upper Garden (KUG), silking follows many weeks after tasseling; this prevents a majority of pollenation and leads to lower yields in that garden.
Explore the plot below. You can hover over the plot to view the individual values. Use the slider at the bottom of the graph to move through the growth stages. You can isolate a particular garden by double clicking its name in the legend at the right of the graph; a single click will turn a garden on or off. Finally, you can download an image of the graph by hovering over it and clicking the small camera icon in the upper right.
Maize yield
Hopi maize grown during the PFP flourished in the Mesa Verde region. Although some gardens failed to produce yields in some years, many of the gardens produced substantial yields. The highest yielding garden was the Mike Coffey Garden (MCG) in 2015, which produced an average yield of 2567 kg/ha of maize. To put that into perspective, such a yield rate would have easily supported 16 people for one year from a one hectare field! The average yield for all of the gardens from 2009 to 2023 was 396 kg/ha, enough to support about two people for one year from a one hectare field. The data presented above are a summary of the raw yield data, which are available here.
Even though there were really good years with high yields in some gardens, many gardens produced very low yields (although see What we learned for a discussion of low yields). The graph below displays estimated yields from each garden in each year. The yields are displayed as box plots; they show the distribution of possible yields as calculated from the clump data (see Bocinsky and Varien 2017 for a discussion of our methods). The box represents the middle 50% of values; the line in the box is the median, or middle value; the lines extending from the boxes represent the middle 95% of values. Values outside the middle 95% appear as dots above and below the lines. As above, you can isolate a garden by double-clicking its name in the legend at the right of the graph. These data show the importance of traditional ecological knowledge in selecting garden locations—subsistence farmers quickly learn the best places to plant fields, and then they avoid planting in less-optimal places.
Ear diversity
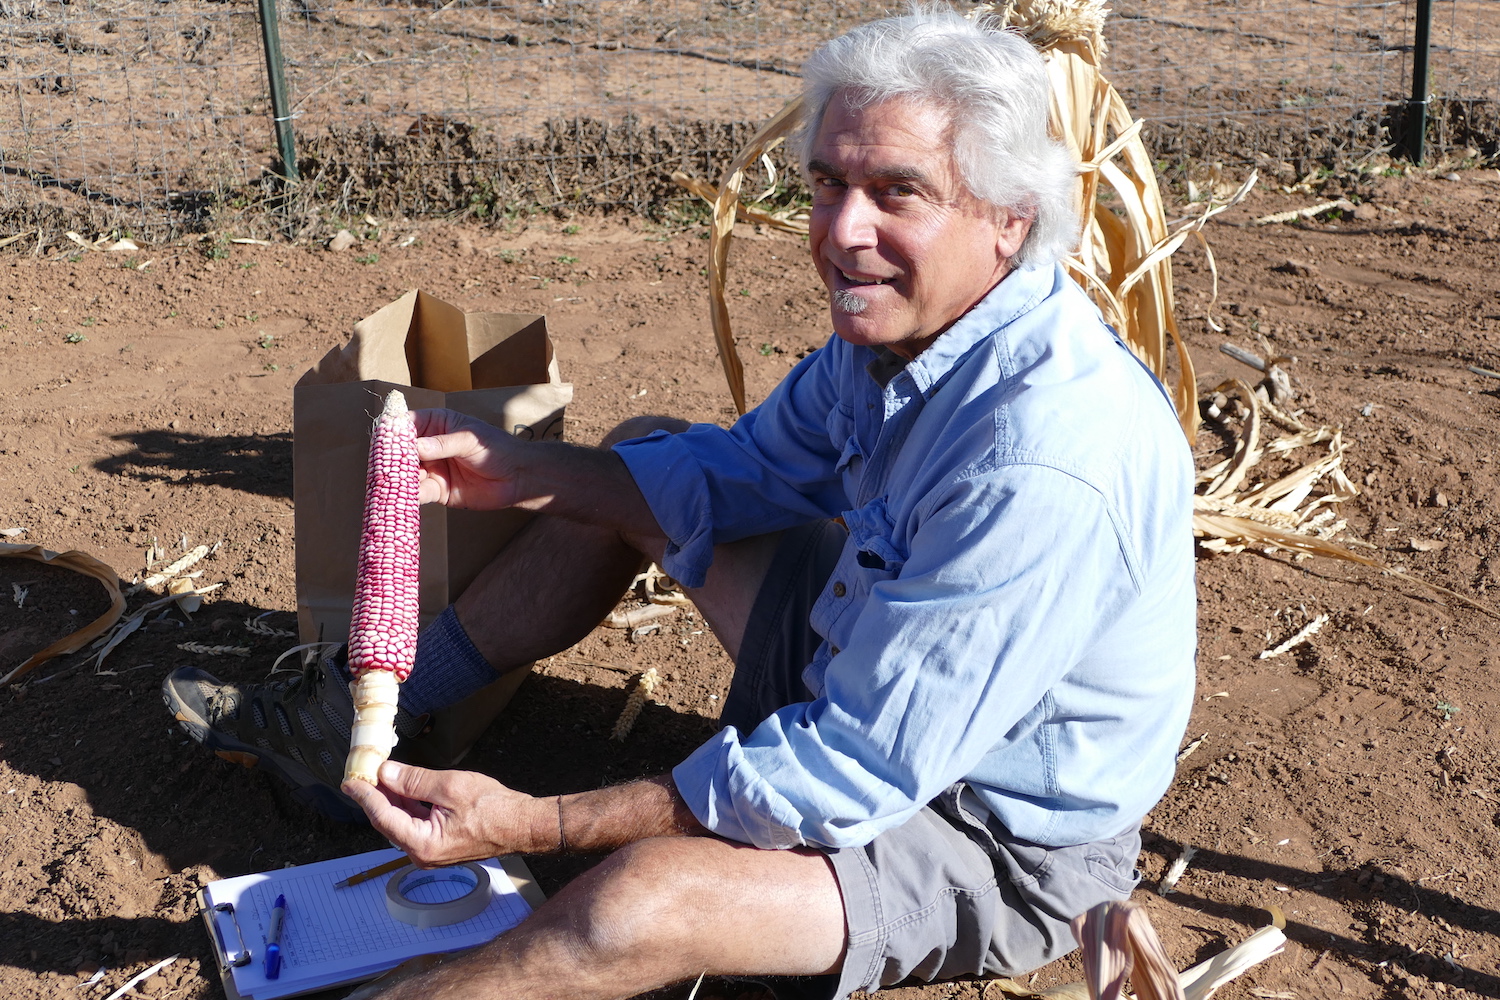
The phenotypes presented by Hopi maize are strongly related to growing conditions. Hopi maize is conventionally thought of as having 12–14 rows; however, under certain conditions, the PFP maize demonstrates that Hopi maize can produce ears with up to 24 rows, as occurred in 2015 in the MCG garden. Still, the median number of rows in full ears in all the gardens during all years was 12, much closer to the conventional number. The average kernel weights for full ears was 74.3 grams. The data presented below are a summary of the raw ear measurement data, which are available here.
The relationship between ear metrics and yield is clear: years with higher yields produced larger ears with more rows and higher kernel weights. Compare the graph below to the yield graph above.
These results suggest that Hopi farmers have developed and maintained the ability of Hopi maize to adapt to a variety of growing conditions. Hopi maize flourishes in the Mesa Verde region, an ancestral Hopi homeland.
Maize genetics
Compared to other Native American groups, Hopi communities have been cultivating maize for millennia with very little influence by Western methods or contemporary industrialized agriculture. As part of the Pueblo Farming Project, researchers performed a genetics study characterizing 95 individual plants from 12 named varieties grown by 6 farmers at the Hopi Mesas (“in situ Hopi” samples) to provide a genetic baseline for Hopi corn today. Kelly Swarts, currently a postdoctoral scholar at the Max Planck Institute for Developmental Biology in Tübingen, Germany, directed the analysis of these 95 plants and compared the results with previously published genotypes in order to contextualize Hopi genetic variation in a global context. The comparative data consist of the following: (1) ancestral Pueblo maize from the site of Turkey Pen ruin in southern Utah, which dates from AD 200; (2) a collection of wild-collected teosinte; and (3) landrace varieties adapted to local conditions—including Hopi accessions (“ex situ Hopi” samples) from across the Americas and held in collections at the USDA Agricultural Research Service and Native Seeds/SEARCH (a non-profit seed-saving organization in Arizona).
Results
- In situ Hopi maize is genetically unique, though very closely related to other temperate maize from the Southwest. Hopi varieties differ from other maize with respect to environmental responses, growth, and physiology.
- Ancestral Pueblo samples from Turkey Pen Shelter are closely associated with the in situ Hopi samples (as to other samples from the temperate Southwest), but in situ Hopi maize has undergone continued selection for desirable traits over the last 2,000 years.
- Hopi material from the ex situ collections demonstrates tropical traits that are not found in the in situ Hopi samples from this study. The cause of this is inconclusive, but this absence demonstrates the necessity of not relying on banked corn from services like USDA-ARS and Native Seeds/SEARCH. That is, analysis on Hopi maize should be performed on new in situ collections.
- Named varieties of Hopi corn are genetically different from one another, although there is a fair amount of genetic overlap between them as well. This suggests that, although contemporary Hopi farming techniques seek to isolate named types, genetic mixing has occurred in the past.
- There is little population structure within the Hopi germplasm (variation is widely distributed), despite the clear morphological and physiological characteristics of the different varieties. This pattern typically results from past intermating between varieties and also indicates seed sharing between farmers across the Hopi Mesas.
- Breeding population sizes, as indicated by estimated inbreeding within populations, are within the healthy range.
These data will all be available for future studies to monitor changes within in situ Hopi germplasm.